Section 0.3 - Science Plots#
This is the third notebook.
|
|
import numpy as np
import matplotlib.pyplot as plt
import scienceplots

import os
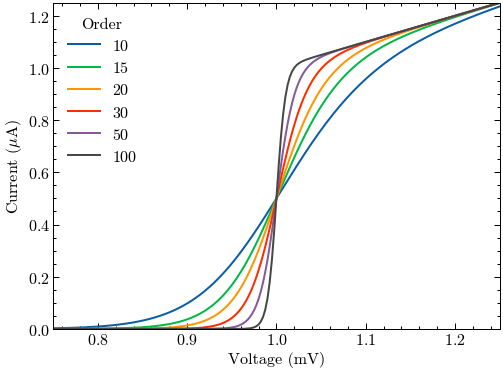
def model(x, p):
    return x ** (2 * p + 1) / (1 + x ** (2 * p))


pparam = dict(xlabel='Voltage (mV)', ylabel=r'Current ($\mu$A)')

x = np.linspace(0.75, 1.25, 201)
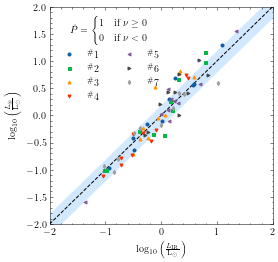
with plt.style.context(['science', 'scatter']):
    fig, ax = plt.subplots(figsize=(4, 4))
    ax.plot([-2, 2], [-2, 2], 'k--')
    ax.fill_between([-2, 2], [-2.2, 1.8], [-1.8, 2.2], color='dodgerblue', alpha=0.2, lw=0)
    for i in range(7):
        x1 = np.random.normal(0, 0.5, 10)
        y1 = x1 + np.random.normal(0, 0.2, 10)
        ax.plot(x1, y1, label=r"$^\#${}".format(i+1))
    lgd = r"$\mathring{P}=\begin{cases}1&\text{if $\nu\geq0$}\\0&\text{if $\nu<0$}\end{cases}$"
    ax.legend(title=lgd, loc=2, ncol=2)
    xlbl = r"$\log_{10}\left(\frac{L_\mathrm{IR}}{\mathrm{L}_\odot}\right)$"
    ylbl = r"$\log_{10}\left(\frac{L_\circledast}{\mathrm{L}_\odot}\right)$"
    ax.set_xlabel(xlbl)
    ax.set_ylabel(ylbl)
    ax.set_xlim([-2, 2])
    ax.set_ylim([-2, 2])
    fig.savefig('figures/fig03.jpg', dpi=300)
    plt.show()
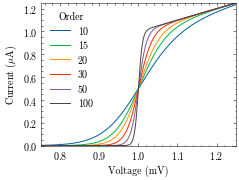
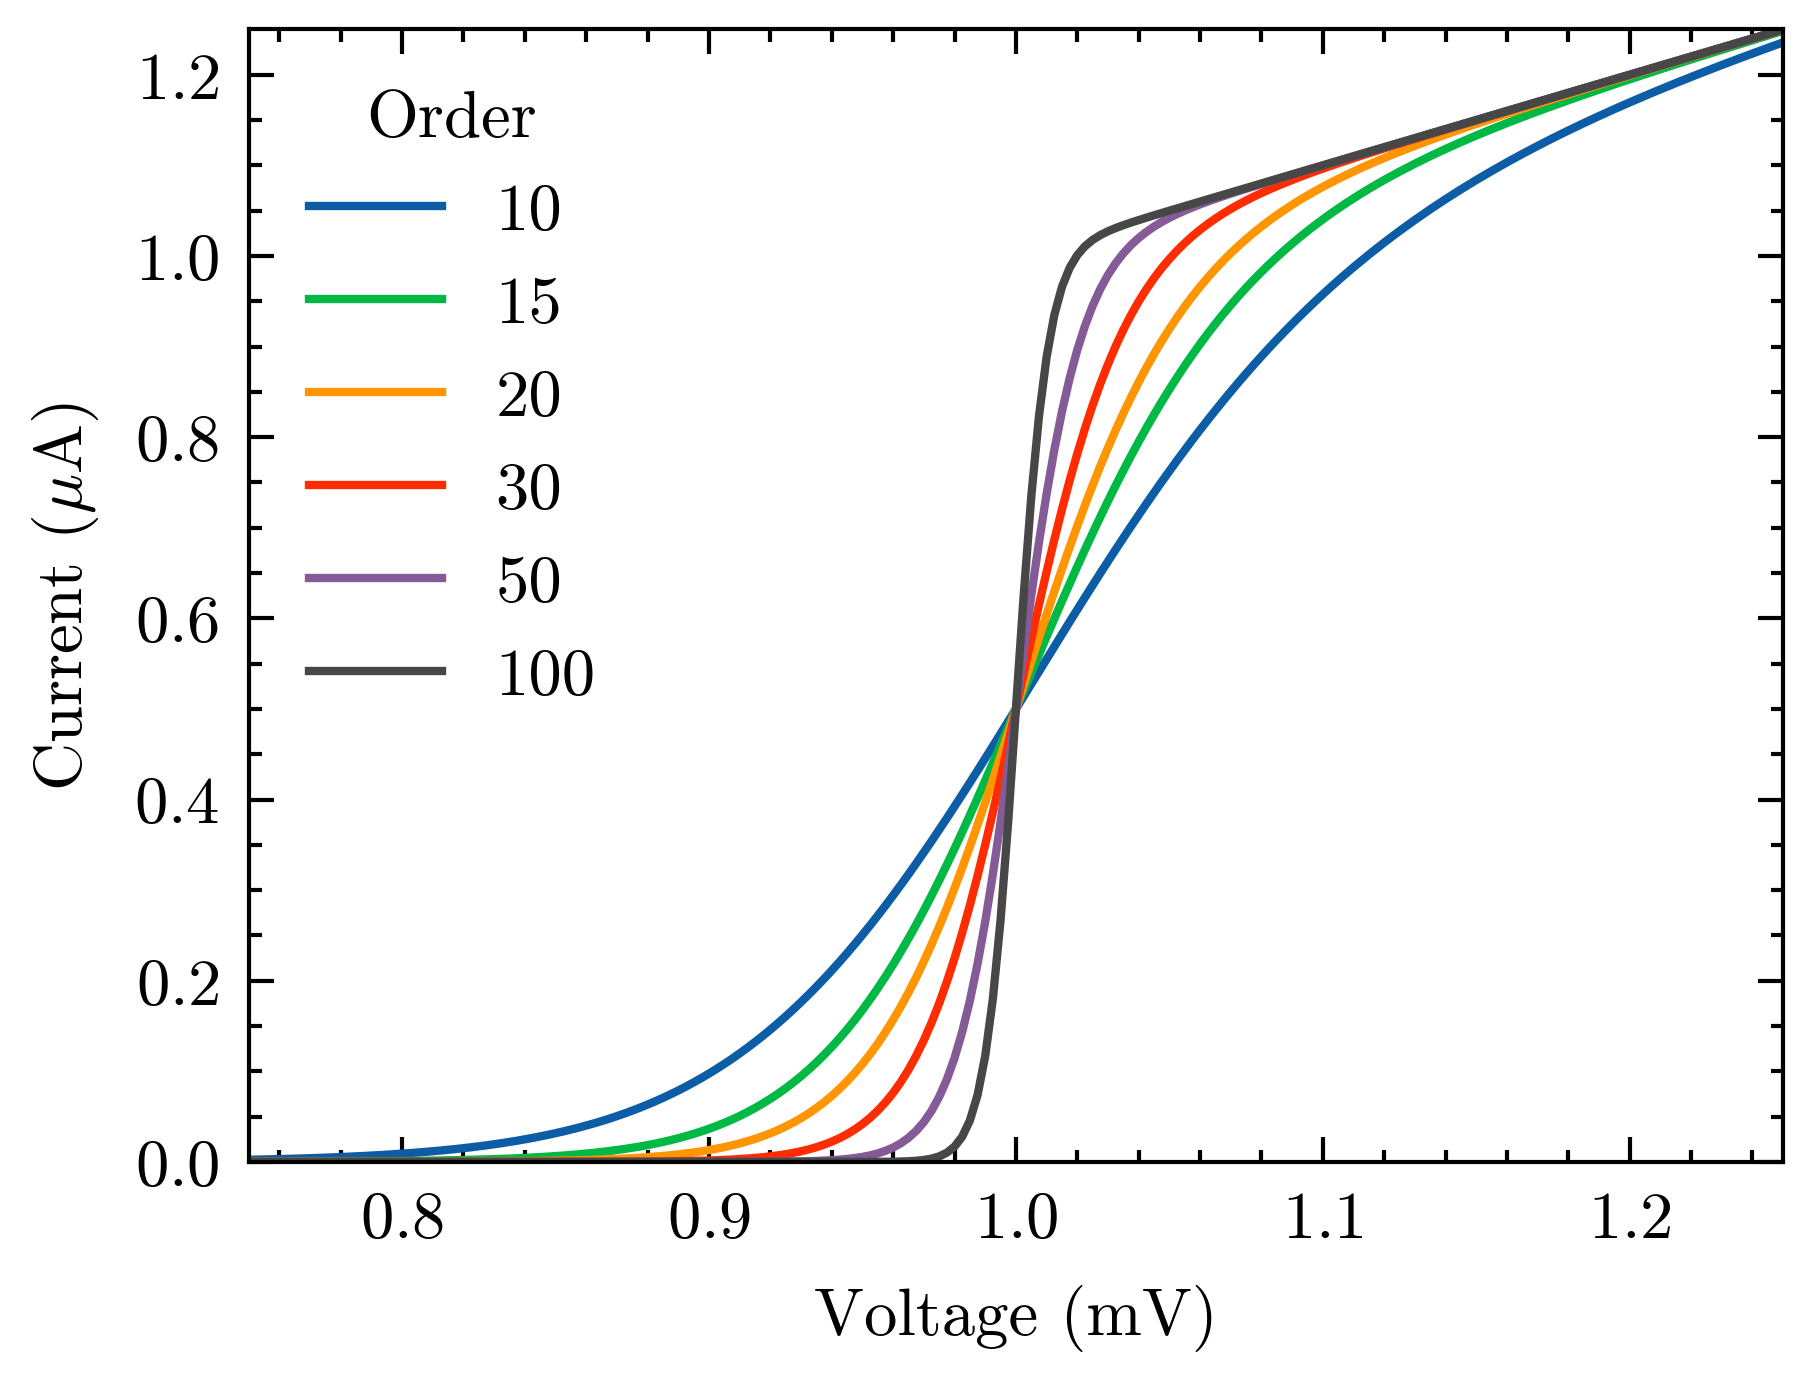
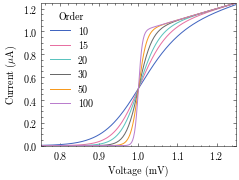
with plt.style.context(['science','no-latex']):
    fig, ax = plt.subplots()
    for p in [10, 15, 20, 30, 50, 100]:
        ax.plot(x, model(x, p), label=p)
    ax.legend(title='Order')
    ax.autoscale(tight=True)
    ax.set(**pparam)
    fig.savefig('figures/fig01a.jpg', dpi=300)
    plt.show()
with plt.style.context(['science', 'no-latex']):
    fig, ax = plt.subplots()
    for p in [10, 15, 20, 30, 50, 100]:
        ax.plot(x, model(x, p), label=p)
    ax.legend(title='Order')
    ax.autoscale(tight=True)
    ax.set(**pparam)
    fig.savefig('figures/fig01b.jpg', dpi=300)
    plt.show()
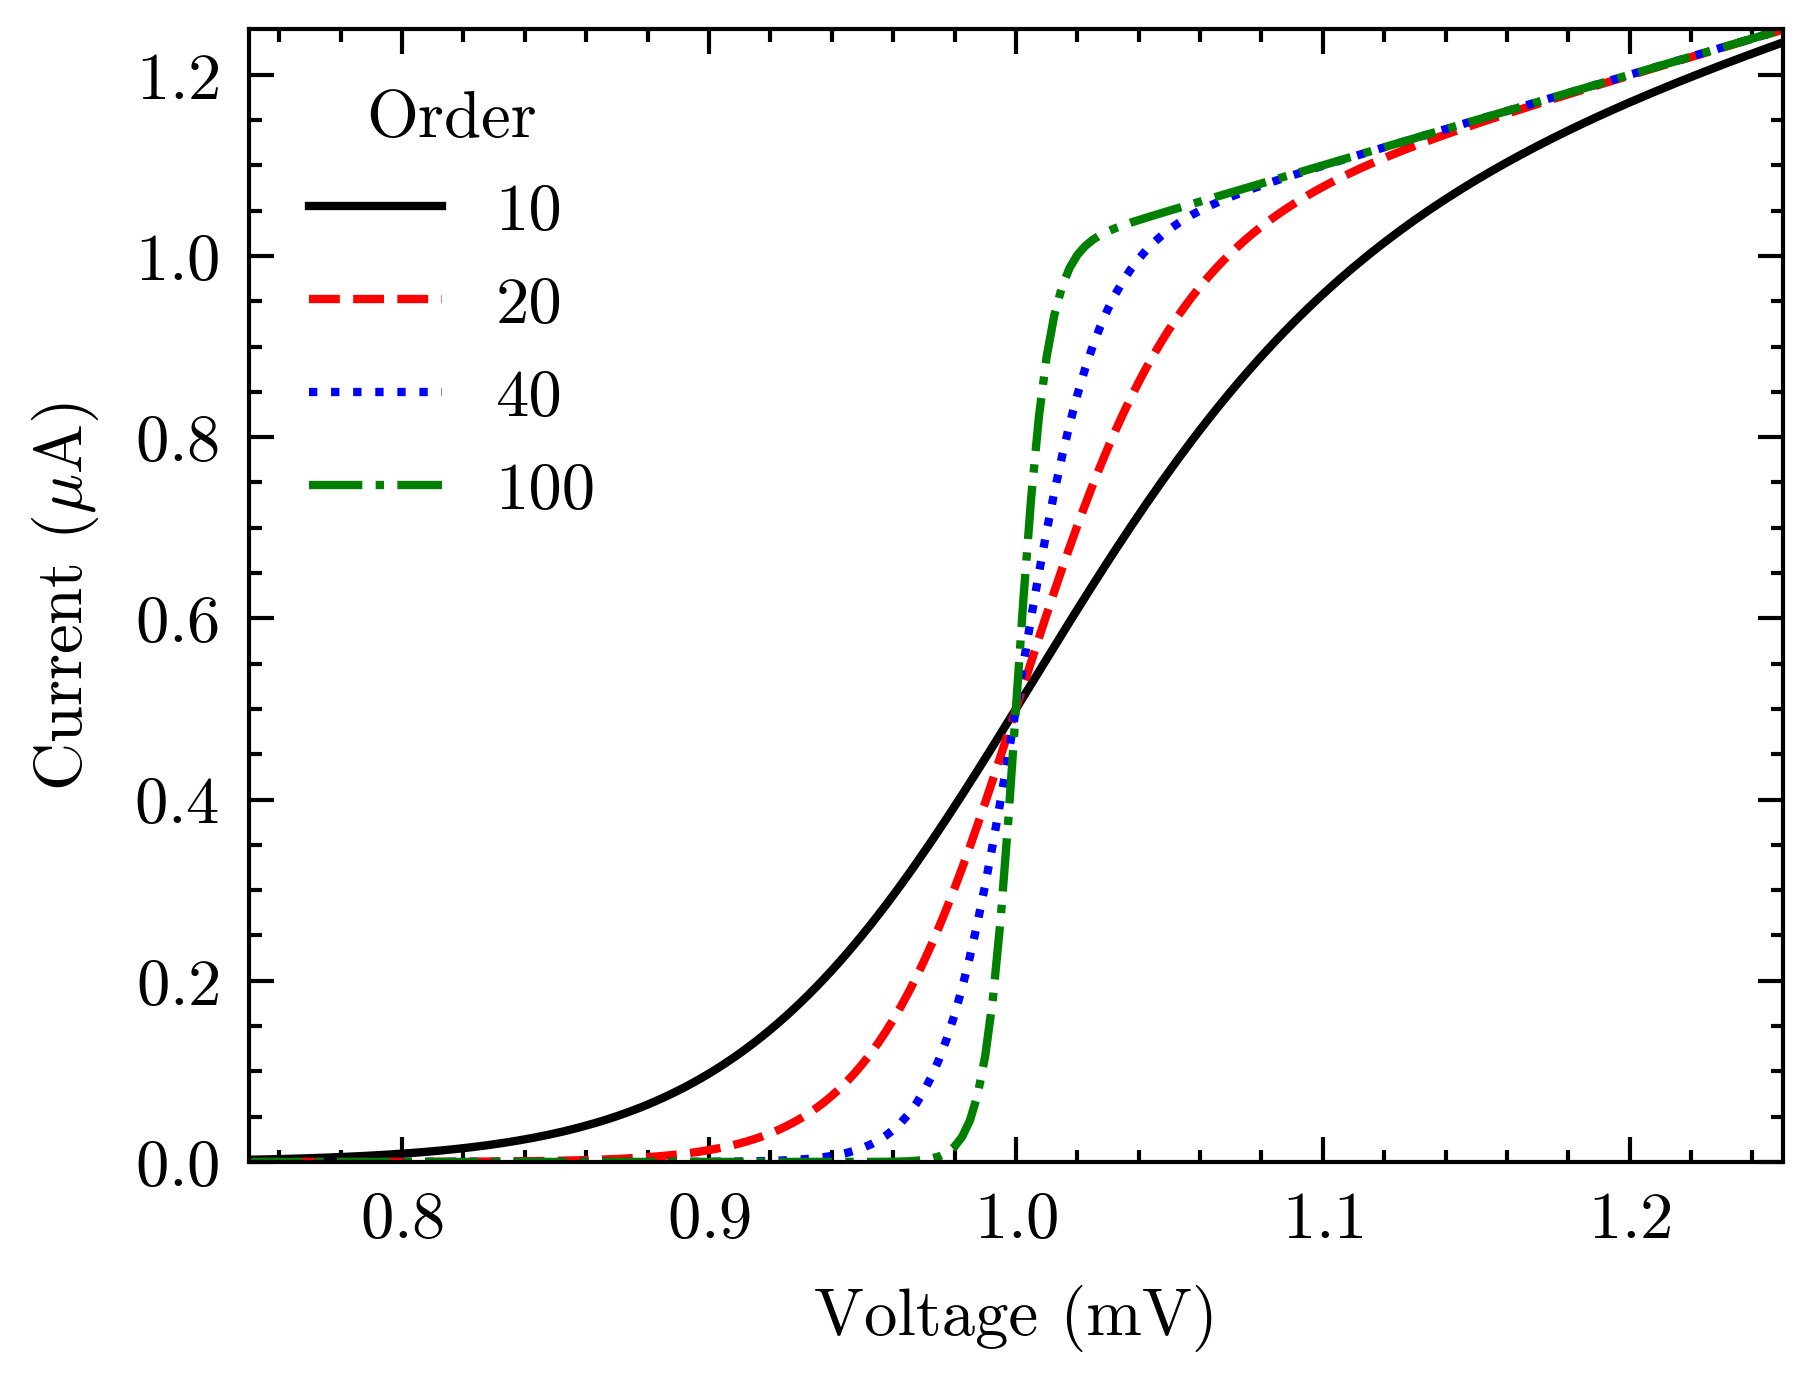
with plt.style.context(['science', 'ieee','no-latex']):
    fig, ax = plt.subplots()
    for p in [10, 20, 40, 100]:
        ax.plot(x, model(x, p), label=p)
    ax.legend(title='Order')
    ax.autoscale(tight=True)
    ax.set(**pparam)
    fig.savefig('figures/fig02a.jpg', dpi=300)
    plt.show()
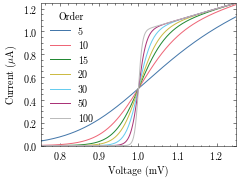
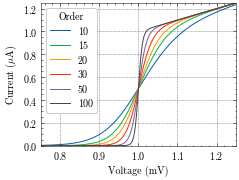
with plt.style.context(['science', 'ieee', 'std-colors','no-latex']):
    fig, ax = plt.subplots()
    for p in [10, 15, 20, 30, 50, 100]:
        ax.plot(x, model(x, p), label=p)
    ax.legend(title='Order')
    ax.autoscale(tight=True)
    ax.set(**pparam)
    fig.savefig('figures/fig02b.jpg', dpi=300)
    plt.show()
with plt.style.context(['science', 'nature','no-latex']):
    fig, ax = plt.subplots()
    for p in [10, 15, 20, 30, 50, 100]:
        ax.plot(x, model(x, p), label=p)
    ax.legend(title='Order')
    ax.autoscale(tight=True)
    ax.set(**pparam)
    fig.savefig('figures/fig02c.jpg', dpi=300)
    plt.show()
with plt.style.context(['science', 'high-vis','no-latex']):
    fig, ax = plt.subplots()
    for p in [10, 15, 20, 30, 50, 100]:
        ax.plot(x, model(x, p), label=p)
    ax.legend(title='Order')
    ax.autoscale(tight=True)
    ax.set(**pparam)
    fig.savefig('figures/fig04.jpg', dpi=300)
    plt.show()
with plt.style.context(['dark_background', 'science', 'high-vis','no-latex']):
    fig, ax = plt.subplots()
    for p in [10, 15, 20, 30, 50, 100]:
        ax.plot(x, model(x, p), label=p)
    ax.legend(title='Order')
    ax.autoscale(tight=True)
    ax.set(**pparam)
    fig.savefig('figures/fig05.jpg', dpi=300)
    plt.show()
with plt.style.context(['science', 'notebook','no-latex']):
    fig, ax = plt.subplots()
    for p in [10, 15, 20, 30, 50, 100]:
        ax.plot(x, model(x, p), label=p)
    ax.legend(title='Order')
    ax.autoscale(tight=True)
    ax.set(**pparam)
    fig.savefig('figures/fig10.jpg', dpi=300)
    plt.show()
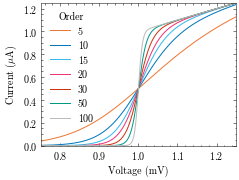
with plt.style.context(['science', 'bright','no-latex']):
    fig, ax = plt.subplots()
    for p in [5, 10, 15, 20, 30, 50, 100]:
        ax.plot(x, model(x, p), label=p)
    ax.legend(title='Order')
    ax.autoscale(tight=True)
    ax.set(**pparam)
    fig.savefig('figures/fig06.jpg', dpi=300)
    plt.show()
with plt.style.context(['science', 'vibrant','no-latex']):
    fig, ax = plt.subplots()
    for p in [5, 10, 15, 20, 30, 50, 100]:
        ax.plot(x, model(x, p), label=p)
    ax.legend(title='Order')
    ax.autoscale(tight=True)
    ax.set(**pparam)
    fig.savefig('figures/fig07.jpg', dpi=300)
    plt.show()
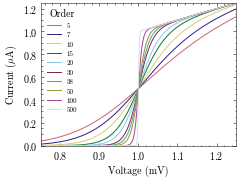
with plt.style.context(['science', 'muted','no-latex']):
fig, ax = plt.subplots()
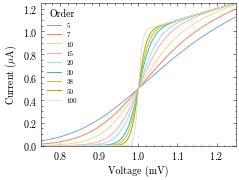
for p in [5, 7, 10, 15, 20, 30, 38, 50, 100, 500]:
ax.plot(x, model(x, p), label=p)
ax.legend(title='Order', fontsize=7)
ax.autoscale(tight=True)
ax.set(**pparam)
fig.savefig('figures/fig08.jpg', dpi=300)
plt.show()
with plt.style.context(['science', 'retro','no-latex']):
    fig, ax = plt.subplots()
    for p in [10, 15, 20, 30, 50, 100]:
        ax.plot(x, model(x, p), label=p)
    ax.legend(title='Order')
    ax.autoscale(tight=True)
    ax.set(**pparam)
    fig.savefig('figures/fig09.jpg', dpi=300)
    plt.show()
with plt.style.context(['science', 'grid','no-latex']):
    fig, ax = plt.subplots()
    for p in [10, 15, 20, 30, 50, 100]:
        ax.plot(x, model(x, p), label=p)
    ax.legend(title='Order')
    ax.autoscale(tight=True)
    ax.set(**pparam)
    fig.savefig('figures/fig11.jpg', dpi=300)
    plt.show()
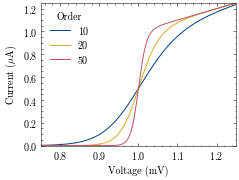
with plt.style.context(['science', 'high-contrast','no-latex']):
    fig, ax = plt.subplots()
    for p in [10, 20, 50]:
        ax.plot(x, model(x, p), label=p)
    ax.legend(title='Order')
    ax.autoscale(tight=True)
    ax.set(**pparam)
    fig.savefig('figures/fig12.jpg', dpi=300)
    plt.show()
with plt.style.context(['science', 'light','no-latex']):
    fig, ax = plt.subplots()
    for p in [5, 7, 10, 15, 20, 30, 38, 50, 100]:
        ax.plot(x, model(x, p), label=p)
    ax.legend(title='Order', fontsize=7)
    ax.autoscale(tight=True)
    ax.set(**pparam)
    fig.savefig('figures/fig13.jpg', dpi=300)
    plt.show()